Navigating Squad Depth Charts and Fixture Congestion Ripples Across Premier Leagues and Pro Circuits for Precision Multi-Leg Structures
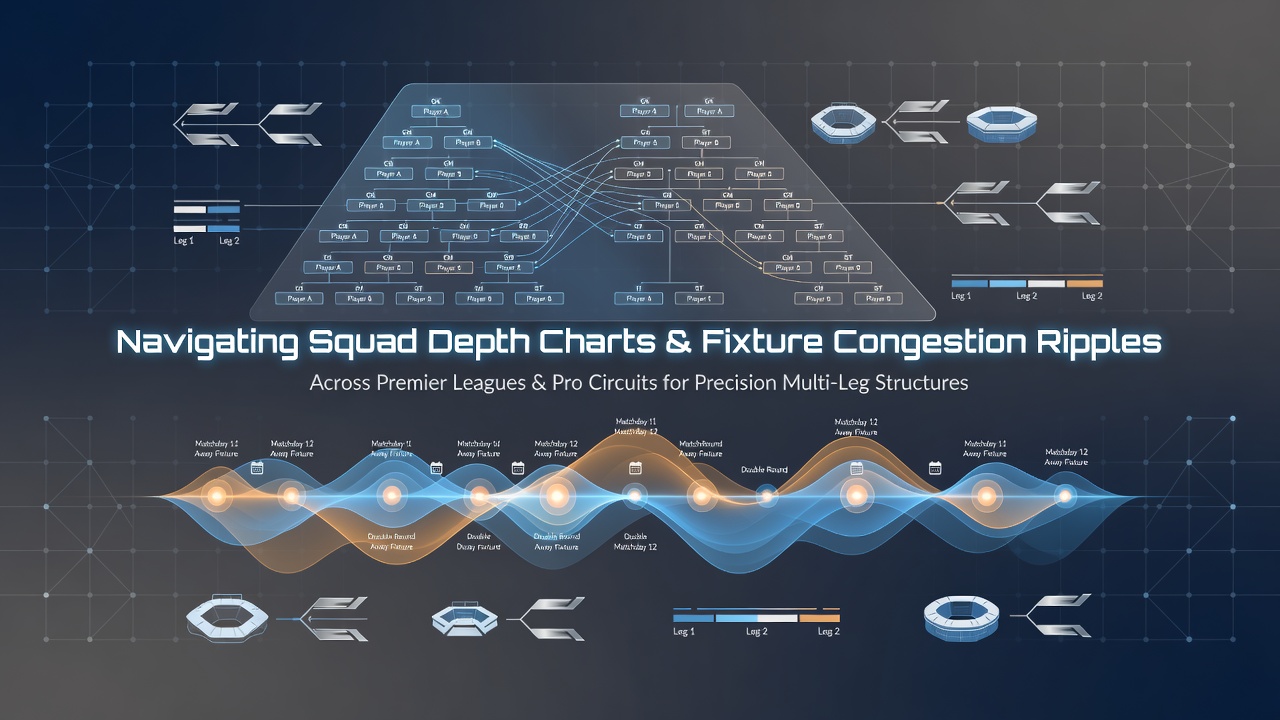 Analysts track squad depth charts as teams rotate personnel through packed schedules that span soccer leagues, basketball circuits, and tennis tours, and these rotations create measurable shifts in performance metrics that feed into layered selection models. Fixture lists released by governing bodies often cluster high-stakes matches within short windows, forcing coaches to balance rest against tactical continuity, while data from performance tracking systems records the resulting changes in workload distribution across rosters.
Depth Chart Mechanics in Congested Periods
Coaches update depth charts weekly based on recovery data, injury reports, and tactical needs, and these updates become especially critical when teams face three or more competitive fixtures inside fourteen days. In the Premier League, for instance, midweek cup ties overlap with weekend league rounds, prompting managers to insert squad players who log fewer than sixty minutes in prior games, according to match logs compiled by league statisticians. Similar patterns appear in the NBA, where back-to-back games and cross-country travel force rotations that alter starting lineups and bench minutes, figures that teams publish through official media releases.
Researchers at the Australian Institute of Sport have documented how accumulated fatigue alters key indicators such as sprint frequency and pass completion rates during congested blocks, and these datasets allow analysts to map expected output ranges for individual athletes across multiple events. The same approach extends to tennis, where players navigate consecutive tournaments on different surfaces, and depth considerations shift from team rotations to individual recovery protocols between matches.
Fixture Scheduling Patterns and Performance Ripples
League calendars published each spring reveal clusters of fixtures that intensify during winter months in European soccer and during the NBA's holiday stretch, and these clusters produce measurable drops in team efficiency when travel distance exceeds a certain threshold. Data from the NBA shows that teams playing four games in six days post fewer points per possession on the road than during standard schedules, while soccer clubs report higher rates of muscular injuries after sequences that include domestic cups and continental ties. Observers note that these patterns repeat across seasons, allowing statistical models to assign probability bands to outcomes when specific players feature in or sit out congested periods.
Cross-League Applications for Multi-Event Structures
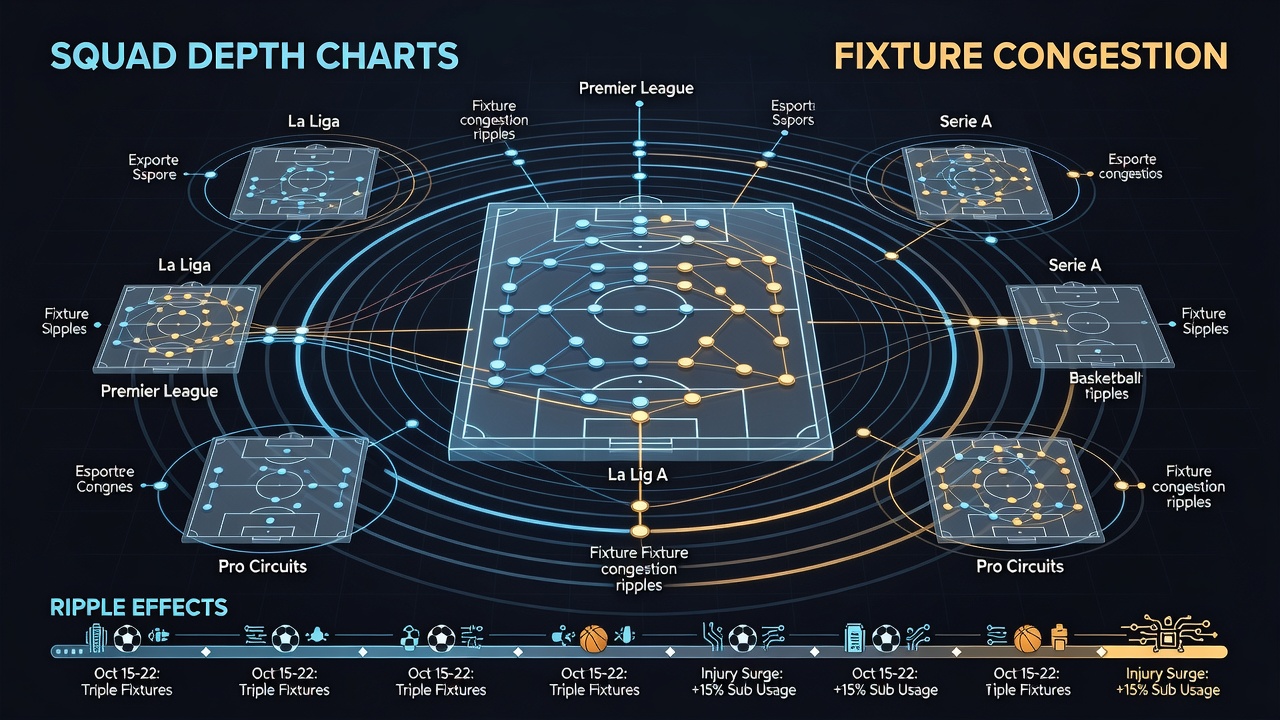
Analysts combine squad availability data from soccer, basketball, and tennis into unified frameworks that weight each leg according to rest differentials and historical performance under load, and such frameworks draw on publicly released injury timelines alongside official schedule documents. In July 2026, pre-season tours and early domestic rounds will create overlapping windows that mirror regular-season congestion, giving modelers fresh datasets on how early rotations affect later legs in multi-event sequences. European Commission reports on athlete workload have highlighted the value of aligning squad data across sports for comparative analysis, and these alignments help refine selection criteria that span different competition formats.
Teams publish depth charts and availability reports through club channels, while leagues aggregate minutes-played statistics that feed external databases used by performance analysts. Cross-referencing these sources reveals consistent correlations between fixture density and variance in key metrics, such as expected goals in soccer or player efficiency ratings in basketball, which in turn inform the structure of selections that cover multiple matches or tournaments simultaneously.
Conclusion
Depth chart navigation and fixture congestion tracking supply objective inputs for constructing layered selections across premier leagues and professional circuits, and the integration of scheduling data with performance statistics continues to expand as more granular tracking tools become standard. Governing bodies release updated calendars and workload guidelines each year, ensuring that analysts maintain current baselines for evaluating how squad decisions ripple through upcoming multi-leg frameworks.