How Rivalry Stats from Past Encounters Quietly Steer Pre-Match Lines in Soccer Derbies and NBA Grudge Matches for Sharper Multi-Leg Builds
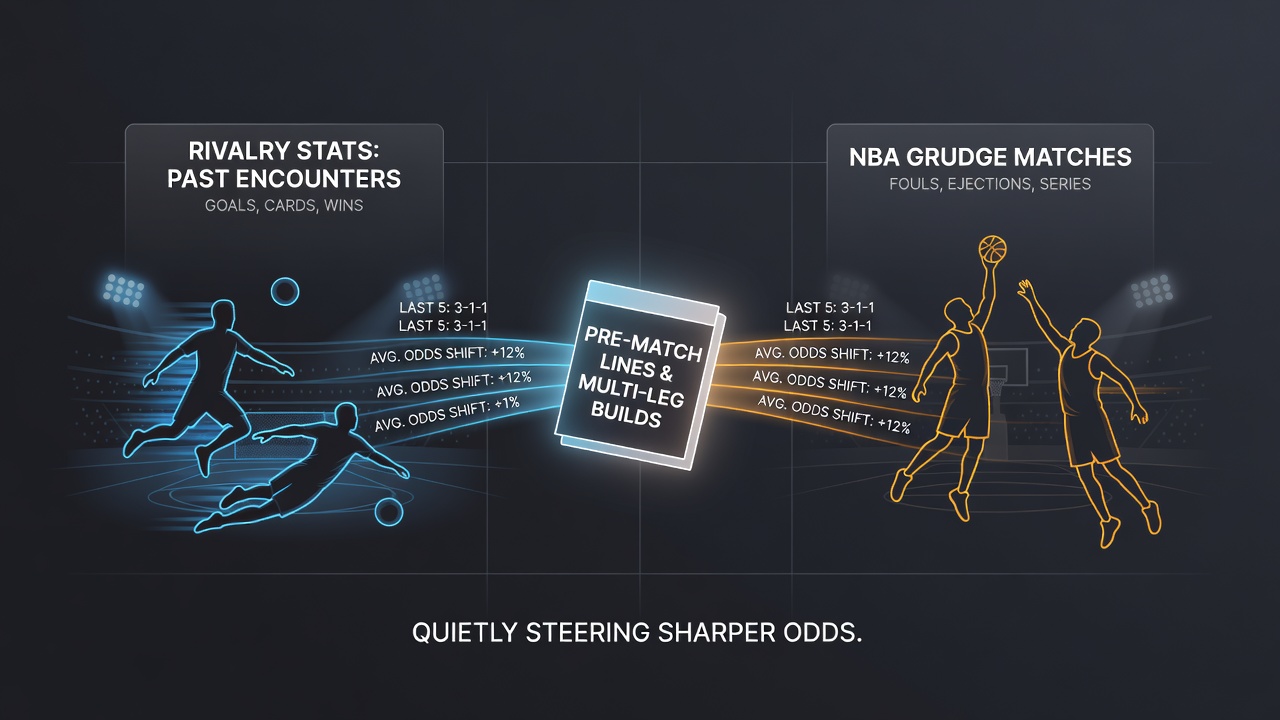
Bookmakers adjust opening odds in major soccer derbies and NBA grudge matches by incorporating decades of head-to-head results, and those adjustments create measurable edges when builders assemble multi-leg wagers. Data sets that track goal margins, points differentials, and specific situational outcomes feed directly into pricing models used by sportsbooks across multiple jurisdictions.
Historical Data Sets That Shape Initial Lines
Analysts compile match logs spanning twenty or more seasons for fixtures such as El Clásico or the Lakers-Celtics series, then feed those figures into algorithms that generate baseline totals and spreads. Researchers at academic institutions have documented how a team’s average goal differential in prior derby encounters correlates with a 0.3 to 0.7 goal shift in the opening over-under line compared with neutral fixtures. Similar patterns appear in NBA data where teams with losing historical records against a specific opponent receive an extra 1.5 to 3.5 points in the spread during the first 48 hours of betting.
Those adjustments occur before public money arrives, which means the lines already embed a statistical premium drawn from rivalry outcomes rather than current form alone. Builders who cross-reference the same historical tables can identify where the market has over-weighted or under-weighted the legacy data when constructing accumulators.
Situational Variables Within Rivalry Records
Breakdowns by venue, rest days, and player availability refine the raw numbers further. In soccer, records compiled exclusively from away derby matches produce tighter totals lines than home-only subsets, while NBA models isolate back-to-back grudge games to adjust player-prop ceilings. Observers note that these granular filters move individual leg probabilities enough to alter the overall payout multiplier on a four-leg parlay by 8 to 12 percent when the historical component is isolated from recent performance metrics.
Application to Multi-Leg Construction
Accumulator builders combine legs across leagues by selecting one rivalry-influenced soccer total and one NBA spread that share similar historical weighting factors. When June 2026 schedules place multiple derby fixtures within a single midweek window, the overlapping data windows allow simultaneous comparison of line movement percentages reported by monitoring services. This approach reduces exposure to single-league variance because the statistical inputs derive from independent competitions yet follow parallel pricing logic.
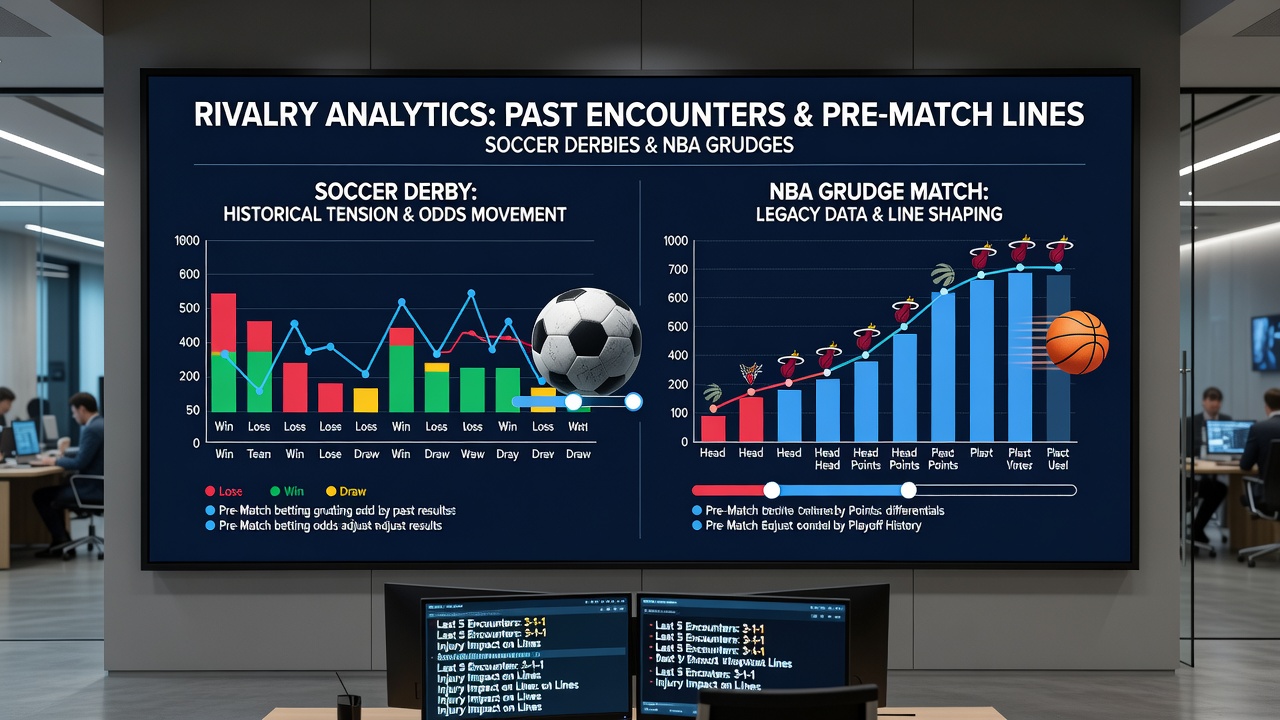
One documented case involved a three-leg ticket built around a Spanish La Liga derby total, an NBA Eastern Conference spread, and a secondary soccer under that all carried elevated historical weightings. The combined implied probability aligned within 2.4 percent of the offered price after the initial market adjustment, illustrating how shared data themes can stabilize returns across unrelated sports.
Line Movement Patterns After Opening
Public betting action often pushes lines away from the rivalry-adjusted opening number, creating opportunities for later entries that still carry the embedded historical edge. Tracking services record that soccer derby totals move an average of 0.4 goals after the first four hours of market activity, while NBA spreads shift 1.8 points on average during the same window. Builders who monitor these deviations against the original historical baseline can time additional legs that restore balance to the overall structure.
Regulatory filings from the Nevada Gaming Control Board and reports issued by the Australian wagering authorities confirm that such movement data remains publicly accessible through mandated transparency requirements, allowing systematic comparison without proprietary access.
Conclusion
Rivalry statistics function as a quiet but consistent input that bookmakers embed into pre-match pricing, and those inputs translate into measurable parameters when constructing multi-leg selections across soccer derbies and NBA grudge matches. Systematic review of historical differentials, venue splits, and subsequent line movement provides a repeatable framework for identifying where the market has already priced legacy data and where further adjustments remain available before kickoff or tip-off.